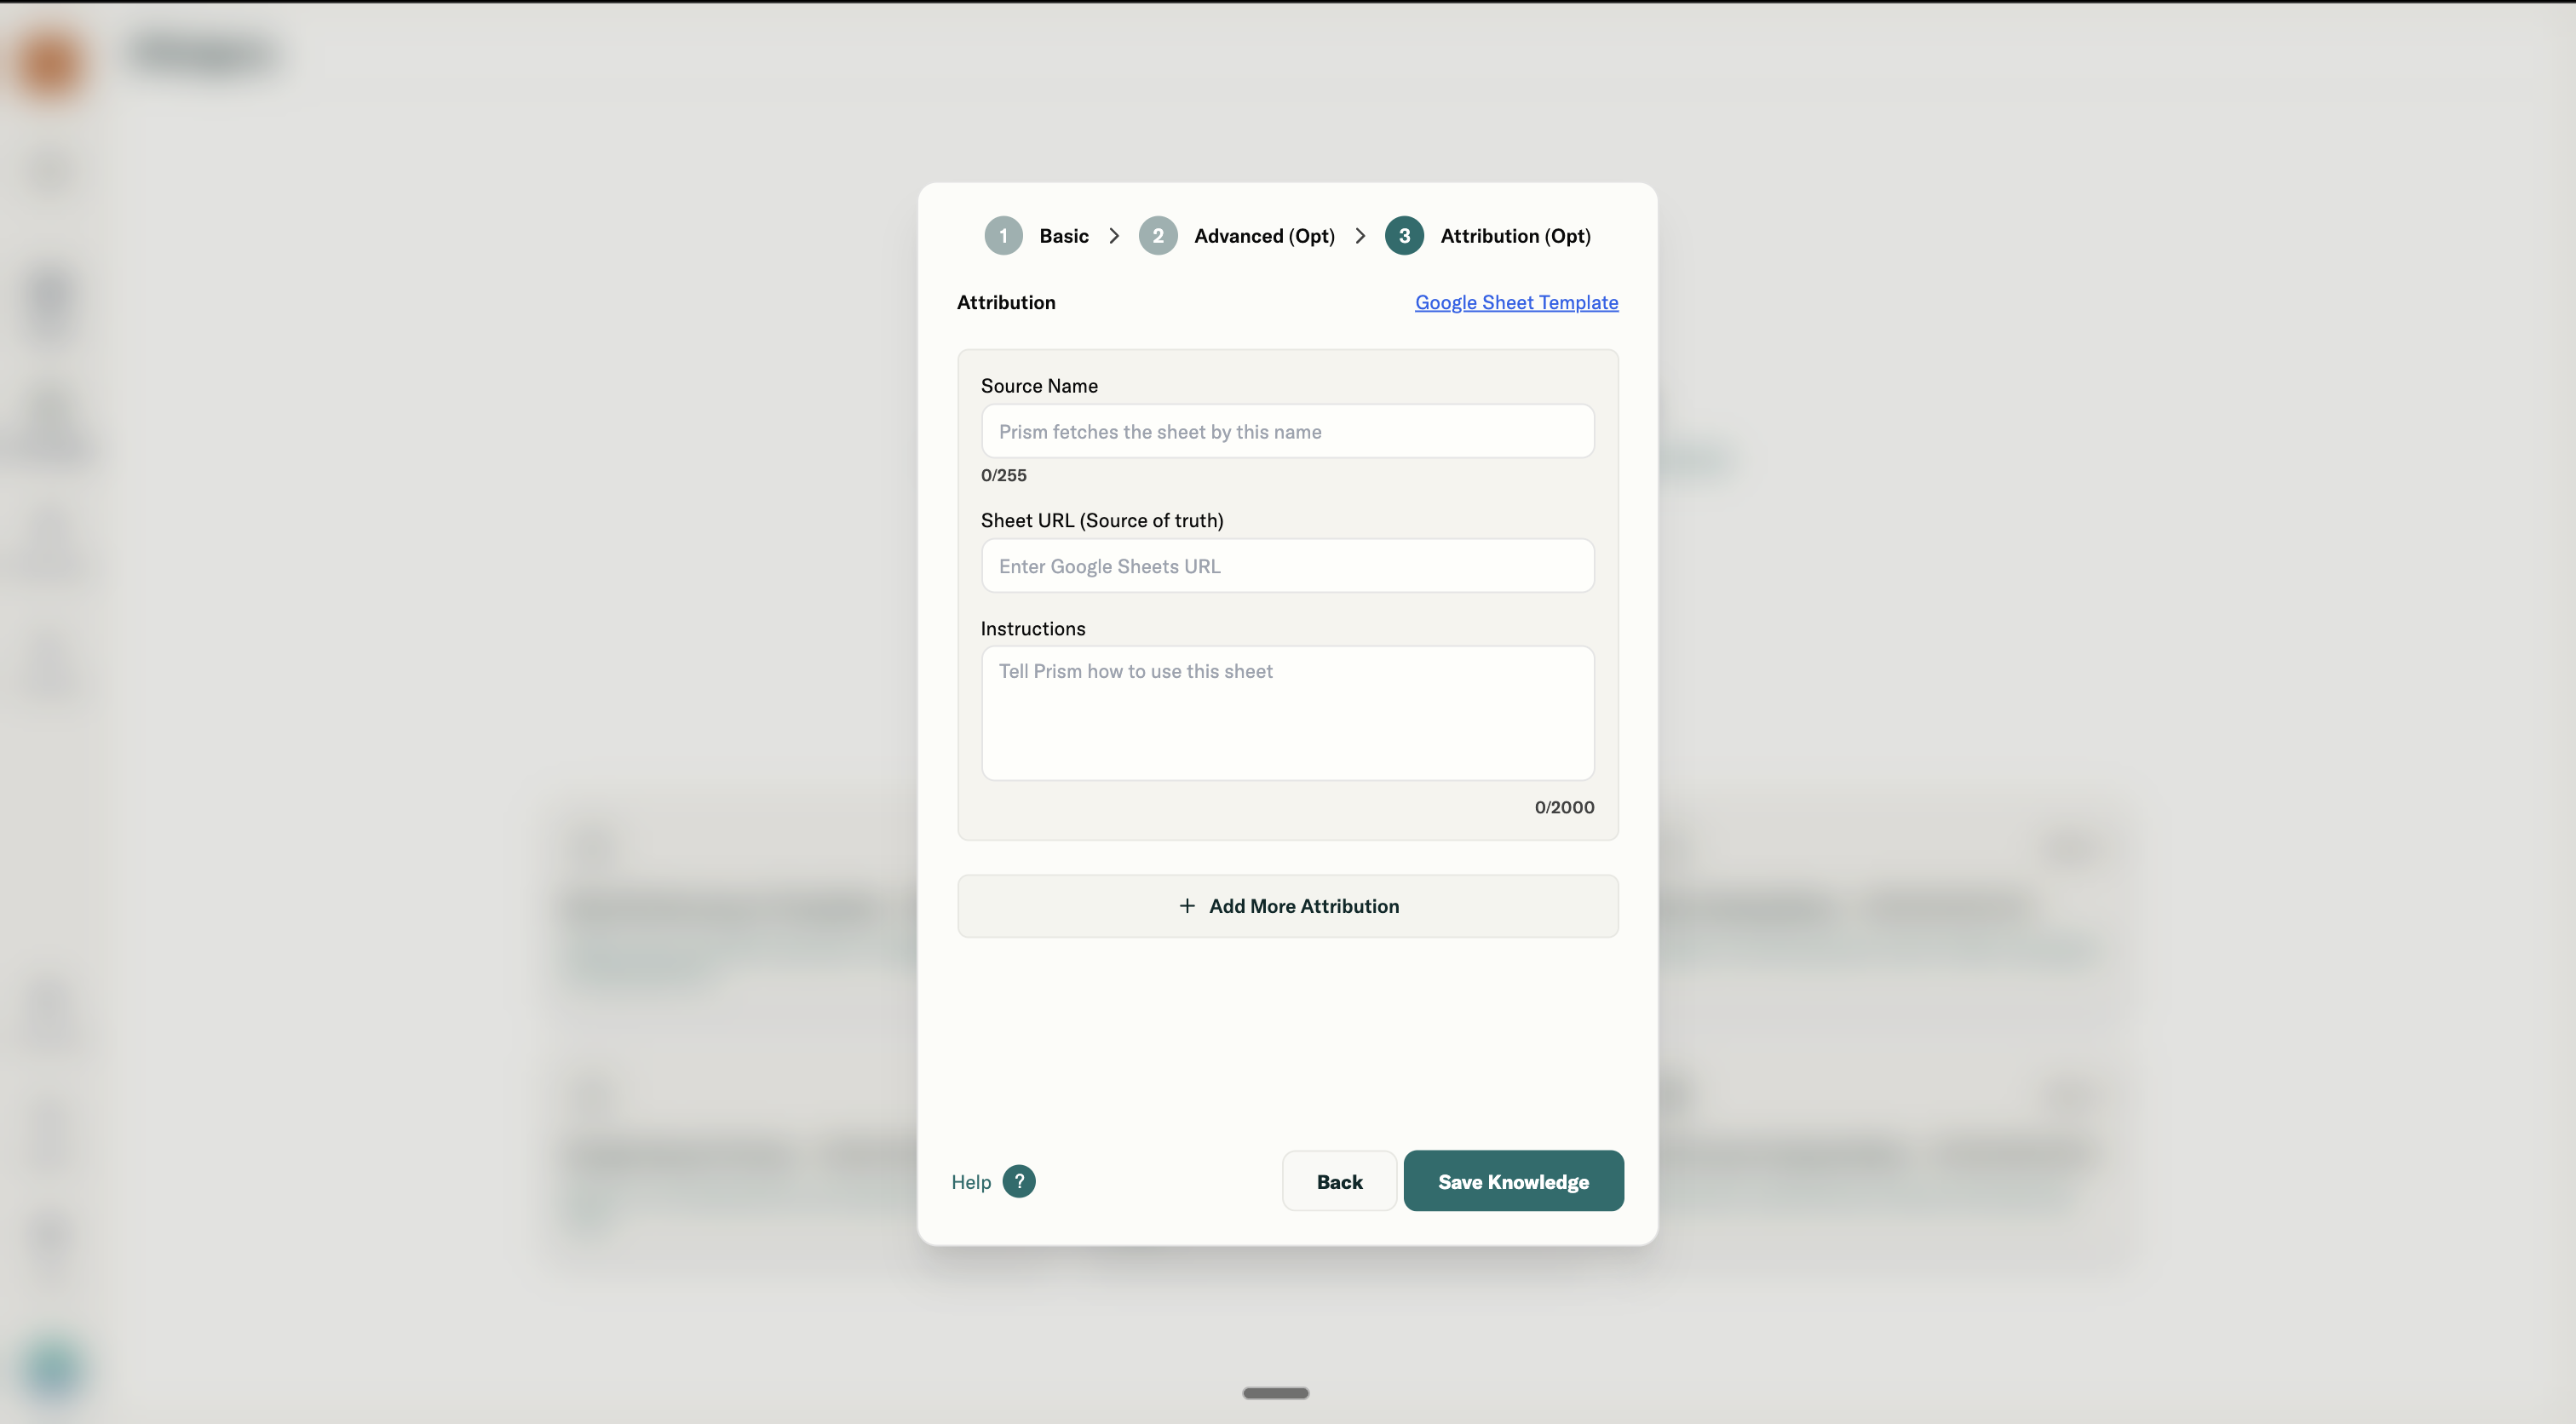
Step 3: Attribution
What Attribution does
Attribution connects live Google Sheets that Prism can query by name. Unlike Step 2 sheets (static context), Attribution sheets are for data retrieval. Users can ask Prism to pull specific data from these sheets.
Example interaction:
User: "From the Enrollment Tracker, show me top enrollments in China last month."
Prism: Queries the sheet, returns results.
Field: Source Name
What it does: This is how Prism identifies and fetches the sheet. Users reference this name in chat.
How to name it well:
- Use names your team would naturally say in conversation
- Be specific enough to distinguish from other sources
Examples:
| Bad | Good |
|---|---|
| Sheet 1 | Enrollment Tracker |
| Data | Regional KPI Sheet |
| Source | Q1 Benchmark Data |
Field: Sheet URL
What it does: The Google Sheet link Prism queries when the source is called.
Requirements:
- Must be a Google Sheet (not Excel, not CSV)
- Sheet must be accessible (check sharing permissions)
- Data should be clean and tabular
Field: Instructions
What it does: Tells Prism how to interpret and use the data in this sheet. This is critical because Prism needs to know what the columns mean and what queries make sense.
How to write Attribution instructions:
-
Specify which tab to evaluate Always refer to the "Meta" tab while fetching the data for this account or brand.
-
Define how to query it
When asked for "top enrollments," sort by Enrollments descending and show the top 10. When asked about a specific region, filter by the Region column.
-
Set default behaviors If no time range specified, use the most recent 4 weeks. Always show Cost alongside Enrollments when presenting results.
-
Note any quirk Week numbers follow ISO standard (Week 1 starts the first Monday of January). "APAC" in this sheet includes China, Japan, and Korea only.
Example full Attribution instruction:
This sheet tracks weekly enrollment data. Columns: Region, Week, Enrollments, Cost, Source. When asked for enrollments, default to last 4 weeks unless specified. "Top" means highest Enrollments count. Always include Cost Per Enrollment (Cost ÷ Enrollments) when showing results. APAC = China + Japan + Korea. EMEA = UK + Germany + France.