Monitoring Portfolios
Portfolio List View (Dashboard)
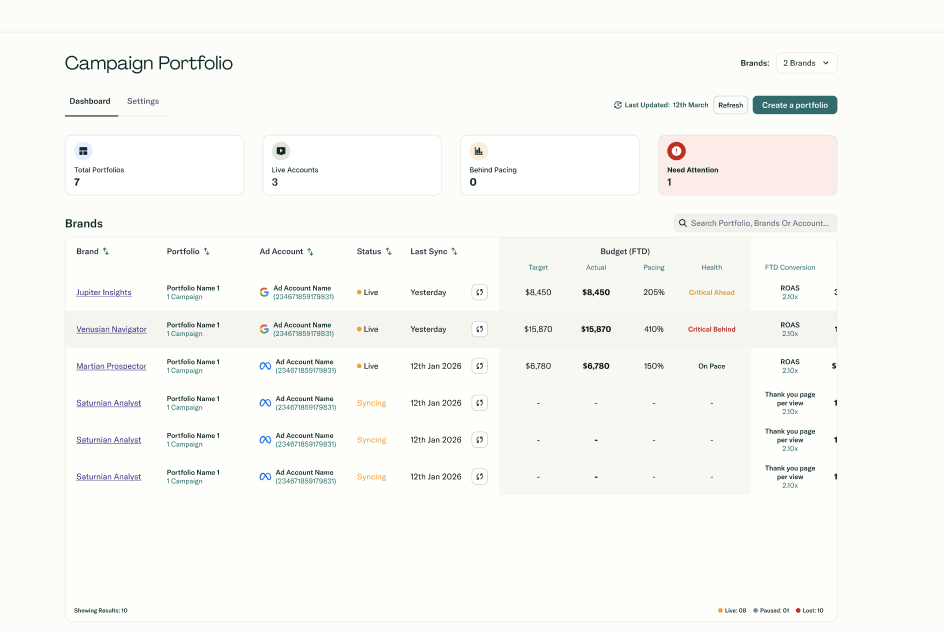
When you land on the portfolio dashboard, you choose your scope from a drop-down:
- This brand: Portfolios for the currently selected brand
- All portfolios: All portfolios across all brands you can access
- {X} brands: A specific subset of brands you select
For each portfolio row, you typically see:
- Health indicator (colored dot)
- Portfolio name
- Brand name
- Ad account name
- Platform (Meta / Google)
- Spend progress: FTD Spend / Monthly Budget + progress bar
- Pacing % with pacing health indicator
- KPI actual vs target with KPI health indicator
- Conversions and revenue
- Campaign count
- Last synced: relative time (e.g., "5 minutes ago")
- Sync button: for Brand Admins only
Summary stats at the top:
- Total number of portfolios
- Number of live portfolios
- Count of portfolios behind pacing (amber or red pacing)
- Count of portfolios that need attention (amber or red KPI status)
Portfolio Detail View
Click a portfolio row to expand it.
Portfolio-level metrics (top section):
- Total spend (currently FTD; plus a 7-day KPI view where available)
- Budget pacing with health indicator
- KPI performance with health indicator
Campaign breakdown table:
For each campaign in the portfolio, you see:
- Campaign name
- Objective
- Status
- Spend
- KPI value
- Last synced
Campaigns are sorted by spend (highest first) so you can focus on what matters most.
Click the row again to collapse the details.